On Wednesday, weaker-than-expected US ADP employment data for December supported gold prices, pushing them to a nearly four-week high of $2669.83 per ounce before settling at $2661.72. Meanwhile, crude oil fell over 1%, pressured by surging US fuel inventories and a stronger dollar, despite intraday gains of over 1% for both WTI and Brent.
Gold Market Overview
Gold prices climbed on Wednesday, supported by softer US ADP employment data, earning the precious metal its highest level in nearly four weeks.
- Close: $2661.72 (+0.49%)
- High: $2669.83
Market Drivers
- ADP Employment Report:
- December ADP employment rose by just 122,000 jobs, below the forecast of 140,000 and the lowest level since August.
- This weak labor market performance heightened expectations for more decisive policy easing from the Federal Reserve later this year.
- Market Commentary:
Bart Melek, Head of Commodity Strategy at TD Securities, remarked, “The bigger impact will come from Friday’s non-farm payroll data. A significantly higher-than-expected figure—forecasted at 163,000—could weigh on gold.” - Fed Minutes and Policy Expectations:
- The Federal Reserve’s December meeting minutes suggested that inflation is likely to continue easing this year.
- Veteran Fed journalist Nick Timiraos noted that the Fed might hold rates steady for now, partly due to Trump’s proposed tariffs and the associated risk of inflationary surprises.
- Strong Dollar and Bond Yields:
- The US Dollar Index rose 0.27% to hover near 109, approaching last week’s two-year high of 109.54.
- The 10-year Treasury yield climbed to 4.693%, peaking at 4.73%, the highest since April 25.
Technical Analysis of Gold
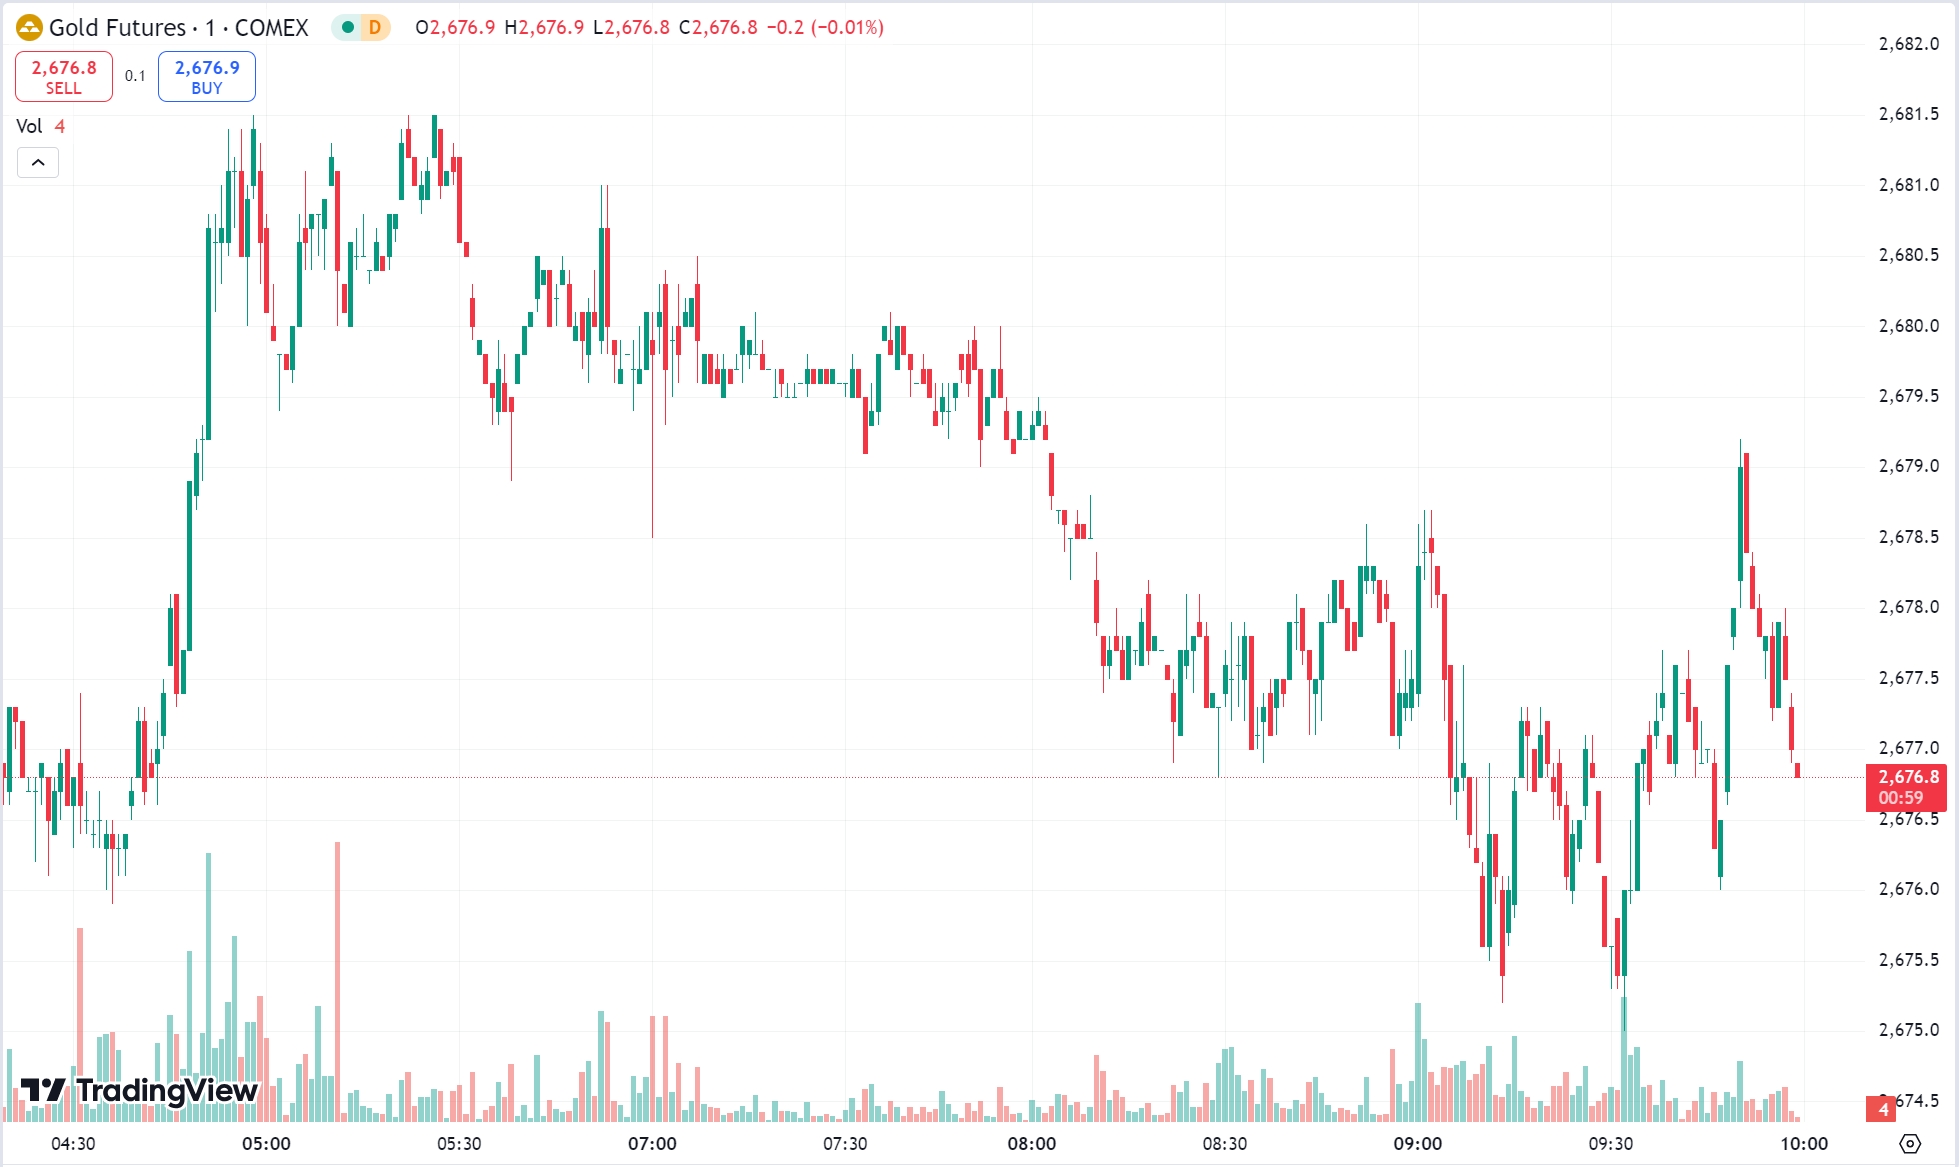
Gold experienced robust upward momentum, with prices breaking above $2660 during the US session. After peaking at $2669, prices faced resistance and retreated to support near $2650 before recovering to close higher.

- Daily Chart: Gold has rebounded for two consecutive days, breaking through the $2640 support and entering a bullish phase.
Today’s Focus & Strategy
- Strategy: Favor buying on dips, with selling at resistance as a secondary approach.
- Resistance: $2675–$2680
- Support: $2650–$2645
Crude Oil Market Overview
Crude oil prices fell over 1% on Wednesday, despite initial gains, as surging US fuel inventories and a stronger dollar weighed on sentiment.
- WTI February Futures: -$0.93 (-1.25%) to $73.32 per barrel.
- Brent March Futures: -$0.89 (-1.15%) to $76.16 per barrel.
Market Drivers
- EIA Inventory Data:
- Crude oil inventories fell by 959,000 barrels last week to 414.6 million barrels, exceeding expectations of a 184,000-barrel decline.
- Gasoline inventories surged by 6.33 million barrels to 237.7 million barrels, much higher than the expected 1.5 million-barrel increase.
- Distillate inventories rose by 6.1 million barrels to 128.9 million barrels, surpassing the 600,000-barrel forecast.
- Market Commentary:
Andrew Lipow, President of Lipow Oil Associates, noted, “The rapid buildup in gasoline and diesel inventories over the past few weeks has pressured the oil market. With refineries boosting output, fuel stockpiles continue to grow, adding to market challenges.” - Dollar Strength:
- A stronger US dollar made oil more expensive for holders of other currencies, further dampening demand.
- Standard Chartered forecasts Brent crude averaging over $90 per barrel for much of 2025, citing slower production growth and increasing demand as key drivers.
Technical Analysis of Crude Oil
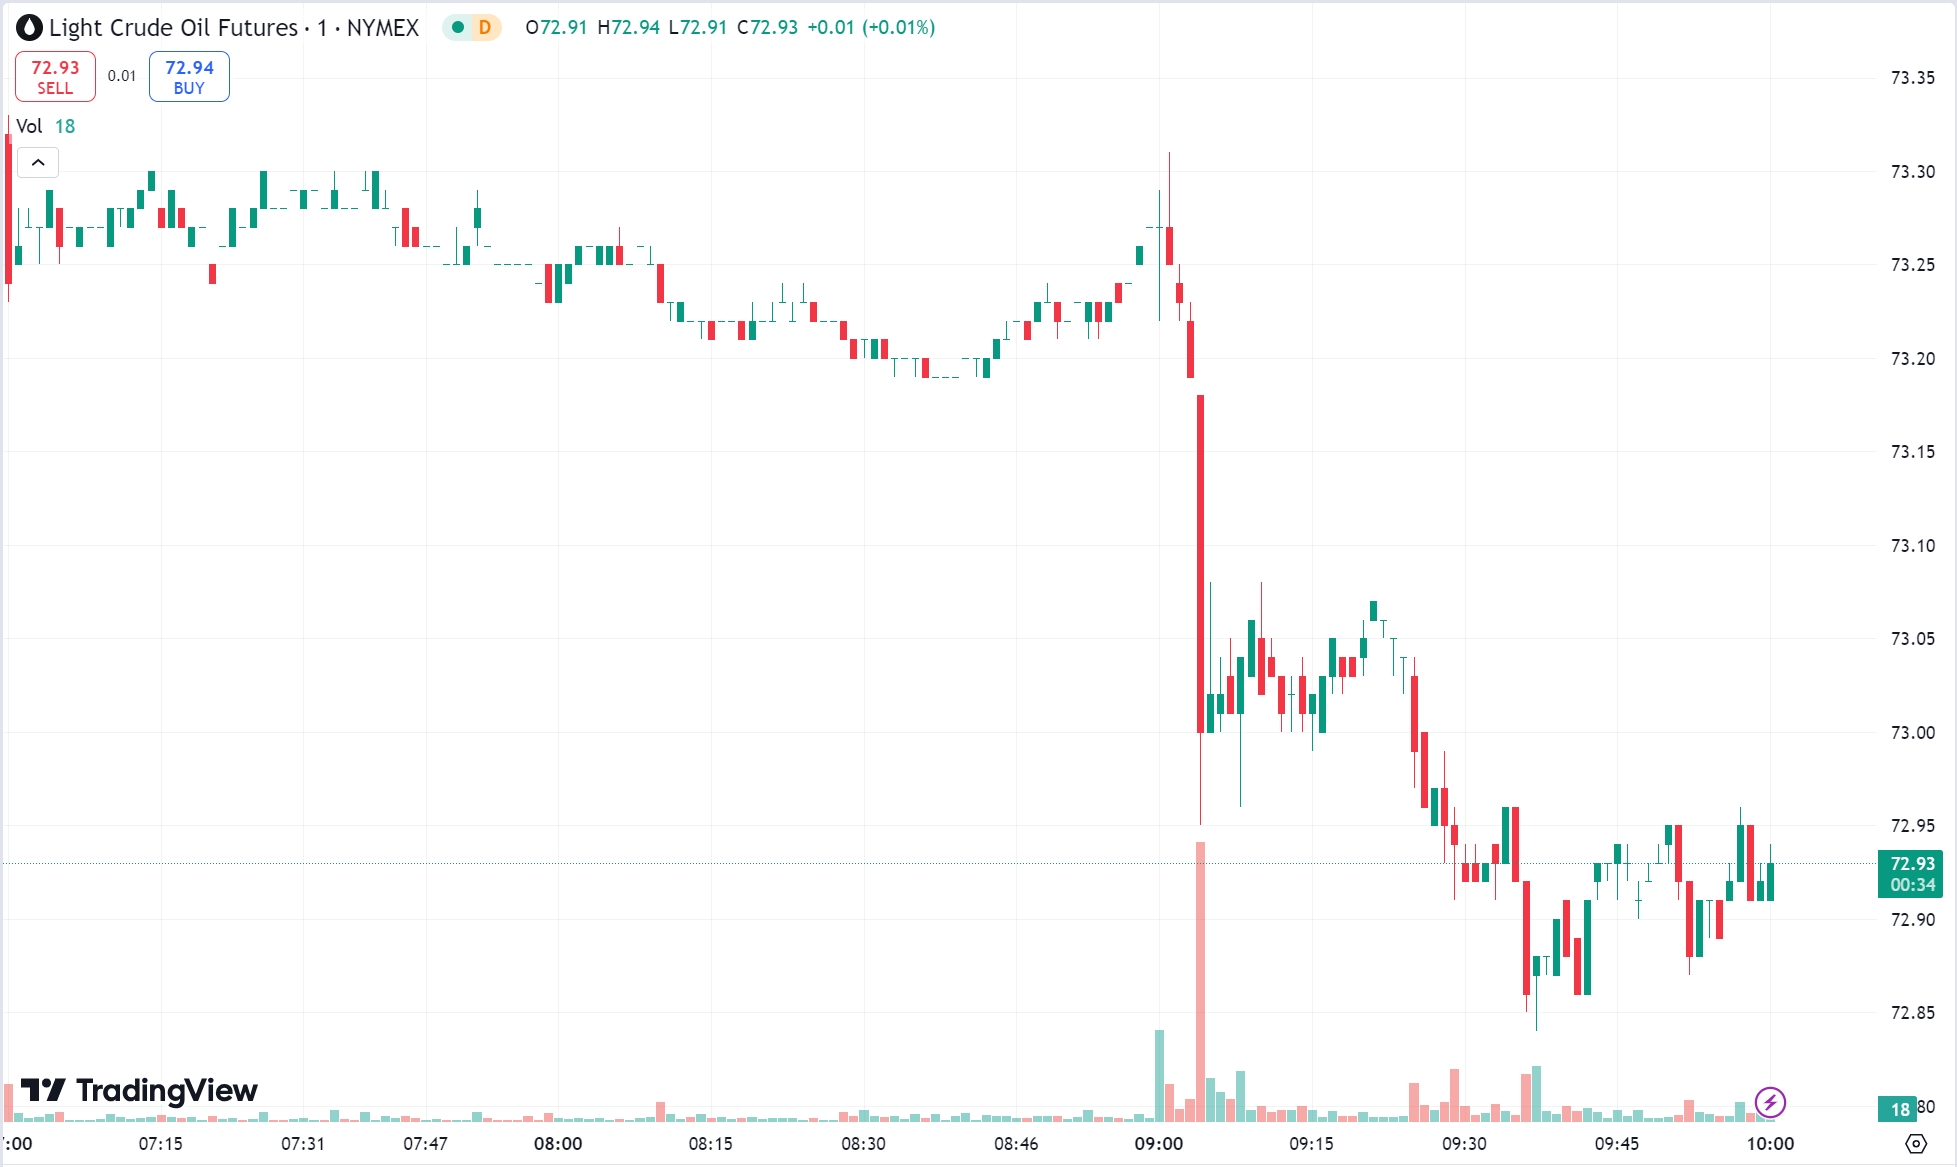
Oil prices faced resistance at $75.2 during the European session before falling below $74 during the US session. WTI closed near $73, forming a bearish candlestick that suggests potential for further downside.

- Daily Chart: Despite short-term weakness, technical indicators on the daily chart maintain a bullish alignment, suggesting potential for recovery.
Today’s Focus & Strategy
- Strategy: Favor buying on pullbacks, with selling at resistance as a secondary approach.
- Resistance: $74.3–$74.8
- Support: $72.2–$71.7
Risk Disclosure
Securities, Futures, CFDs and other financial products involve high risks due to the fluctuation in the value and prices of the underlying financial instruments. Due to the adverse and unpredictable market movements, large losses exceeding your initial investment could incur within a short period of time.
Please make sure you fully understand the risks of trading with the respective financial instrument before engaging in any transactions with us. You should seek independent professional advice if you do not understand the risks explained herein.
Disclaimer
This information contained in this blog is for general reference only and is not intended as investment advice, a recommendation, an offer, or an invitation to buy or sell any financial instruments. It does not consider any specific recipient’s investment objectives or financial situation. Past performance references are not reliable indicators of future performance. Doo Prime and its affiliates make no representations or warranties about the accuracy or completeness of this information and accept no liability for any losses or damages resulting from its use or from any investments made based on it.
The above strategies reflect only the analysts’ opinions and are for reference only. They should not be used or considered as the basis for any trading decisions or as an invitation to engage in any transaction. Doo Prime does not guarantee the accuracy or completeness of this report and assumes no responsibility for any losses resulting from the use of this report. Do not rely on this report to replace your independent judgment. The market is risky, and investments should be made with caution.


